Fluke PVA-1500T2 I-V Curve Tracer, Sol Sensor For PV Modules, T2 Unit, 1500 V, 30 A, PVA Series
Our Part #20004894
Mfr Part #PVA-1500T2
Fluke PVA-1500T2 I-V Curve Tracer, Sol Sensor For PV Modules, T2 Unit, 1500 V, 30 A, PVA Series
Our Part #20004894
Condition:New
Mfr Part #PVA-1500T2
- Description
- Specifications
- Documents
Fluke PVA-1500T2 I-V Curve Tracer w/ Sol Sensor For PV Modules
Features and Specifications
- DC Voltage: 1500V
- Current: 30A DC (Module Efficiency <19%)
- Maximum Current (Isc): Module Efficiency ≥19% 10A DC
- Operating Temperature: 0 - 45 degrees C (32 to 113 degrees F)
- Uninterrupted measurements even in hot environments
- In-the-field firmware update ready
- Data Analysis Tool (DAT) Automates data management, analysis, and reporting
PVA-1500T2 I-V Curve Tracer Highlights
Introducing the PVA-1500T2 I-V Curve Tracer with Sol Sensor for PV Modules, a highly developed device designed to significantly change the way you monitor and analyze. It features built-in PV performance modeling and advanced wireless irradiance.
What sets the PVA-1500T2 apart is its temperature and tilt sensing capabilities, allowing for precise adjustments and optimal performance. It boasts an exceptional measurement throughput with sweep-to-sweep delays as low as 9 seconds.
The PVA-1500T2 also saves you valuable time through automated data analysis and reporting, streamlining the process of obtaining and interpreting measurement results. With the PVA-1500T2, you can focus on what matters most - optimizing your PV modules' performance and efficiency.
Accurate I-V Curve Tracing
The Photovoltaic Analyzer (PVA) is a tool that records the current-voltage (I-V) relationship of a photovoltaic (PV) module or string using a capacitive load. This analysis is usually done at the string level, either by directly connecting to the string or via a combiner box, using fuses to choose the string being tested. The I-V curve can be plotted with either 100 or 500 points, as per the selection. Furthermore, the PVA also produces the power-voltage (P-V) curve and calculates the short-circuit current (Isc), open-circuit voltage (Voc), current at maximum power (Imp), voltage at maximum power (Vmp), maximum power (Pmax), fill factor, and performance factor (the ratio of the actual maximum power to the anticipated maximum power).
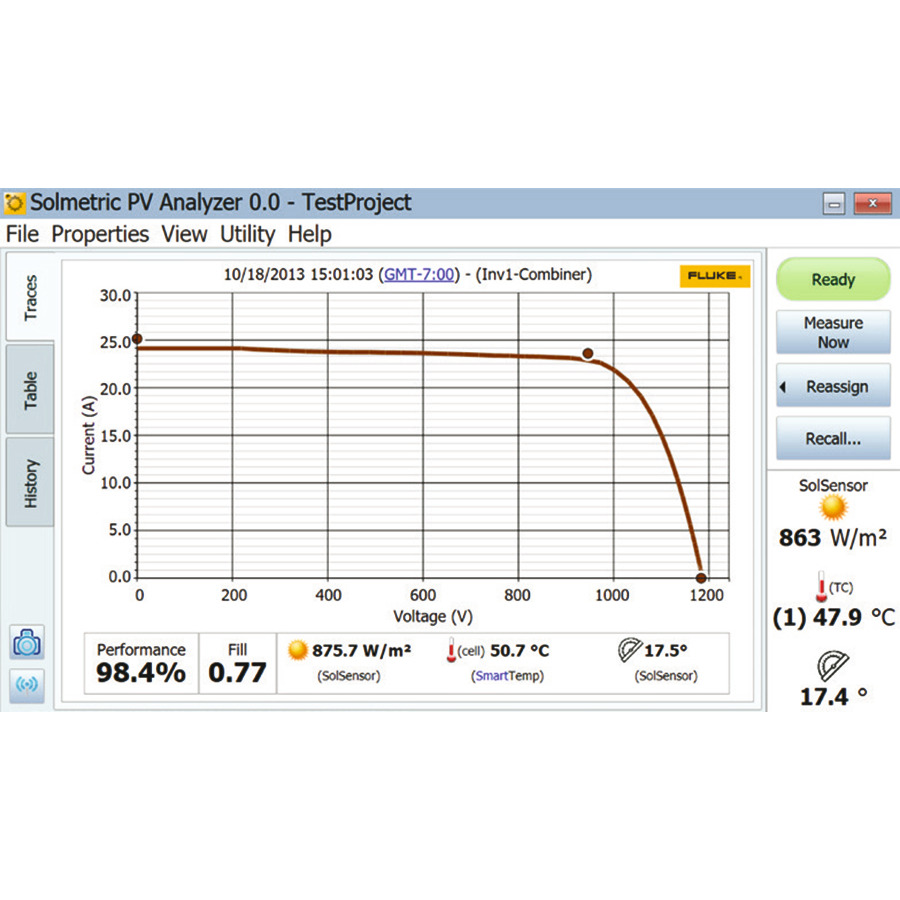
PVA Data Insights, Visualizations And Customizable Reports
Use the PVA Application to gather data in the field and verify the outcomes with the Data Analysis Tool (DAT), a tool based on Microsoft Excel that simplifies the examination of PVA I-V curve data. The DAT displays the results of the analysis in various forms. It assembles crucial PV parameters in a string table, marks strings that don't conform, and provides a statistical summary of the entire array. Moreover, it graphically merges string I-V curves at the combiner box level, providing a clear illustration of uniformity and pinpointing unusual strings. The tool also creates histograms for PV parameters across the string population, and this information can be included in a personalized report that can be exported as a PDF. The Data Analysis Tool (DAT) is available for free download and can be used with any PVA.
Supported languages: English, French, Spanish, German, Italian, Traditional Chinese, Simplified Chinese, and Brazilian Portuguese.
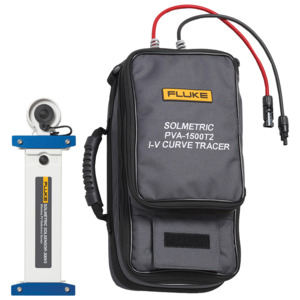
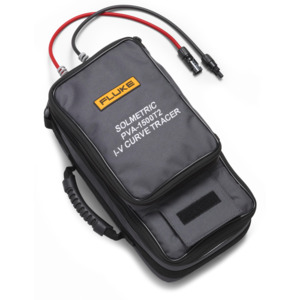
What's in the Box
- PVA T2 unit
- SolSensor and clamp
- Windows application
- Alligator test leads
- MC4 disconnect tool
- Chargers
- Data Analysis Tool (DAT)
- 2x thermocouples
- Adhesive disks
- Sensor cleaning supplies